Capstone: OurAccess
Increasing accessibility on campus
My senior design team developed a website that maps accessible routes between campus buildings that factors in individual access needs. Our project focused on those with mobility issues, while striving to be accessible to all by following WCAG standards.
I served as the site's programmer, user research assistant, and sensitivity advisor on the team.
Final Site >
Lack of accessibility for disabled students has been a widespread problem in academia. The root causes are systemic and quite built into the campus. Addressing the root causes directly would be a massive undertaking that would take years. Instead, we aimed to work with the existing infrastructure to help those with mobility issues find accessible routes in an inaccessible campus.
Our demo site features 17 popular buildings on campus, location tracking, custom access needs for routing (defaults to ADA compliance), customizable display of access features, and step-by-step directions of the shortest route.
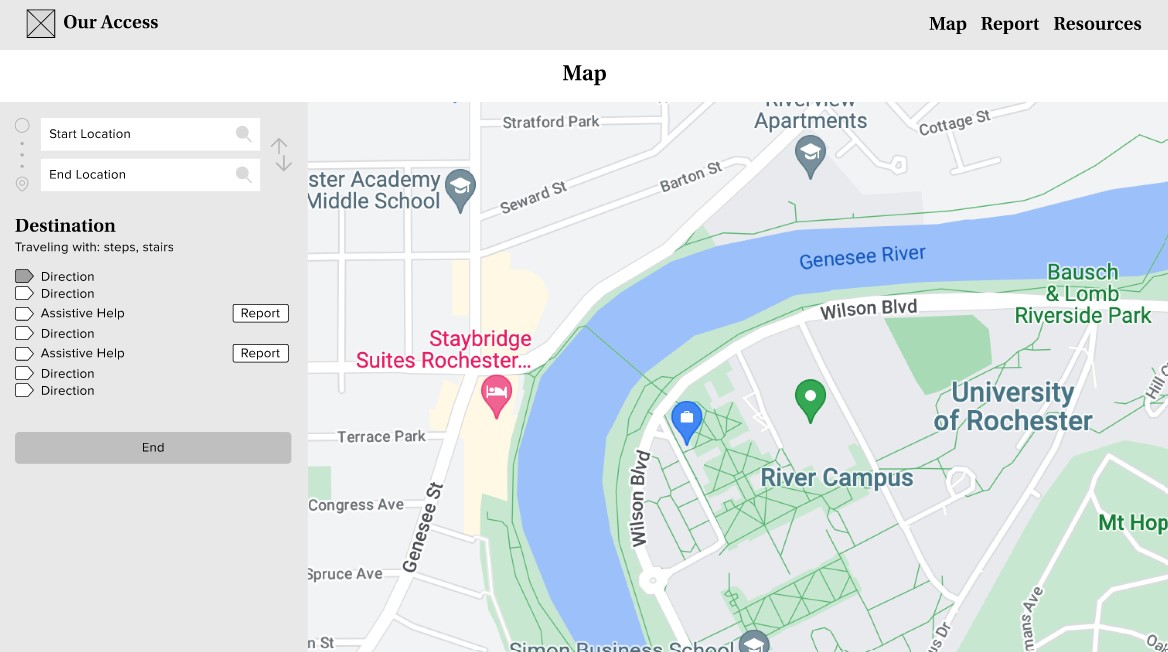
Mobile site routing and reporting demo
September Define Stage
For the define stage, we started with a problem statement before finding insights through design exercises like Point of Views, the 5 Whys, and Empathy Maps.
Problem Statement: I am a student at the U of R with a physical disability. I'm trying to get around campus with mobility issues, but it can be difficult to find an accessible route because not every building on campus is accessible, elevators and automatic door opener buttons break, and unforeseen, temporary circumstances could require detours. This makes me feel frustrated, excluded, and possibly cause additional pain depending on specific mobility issues.
We found that the root of the issue is that much of campus was built before ADA regulations and that common issues were broken door buttons or elevators and not knowing where elevators are in buildings.
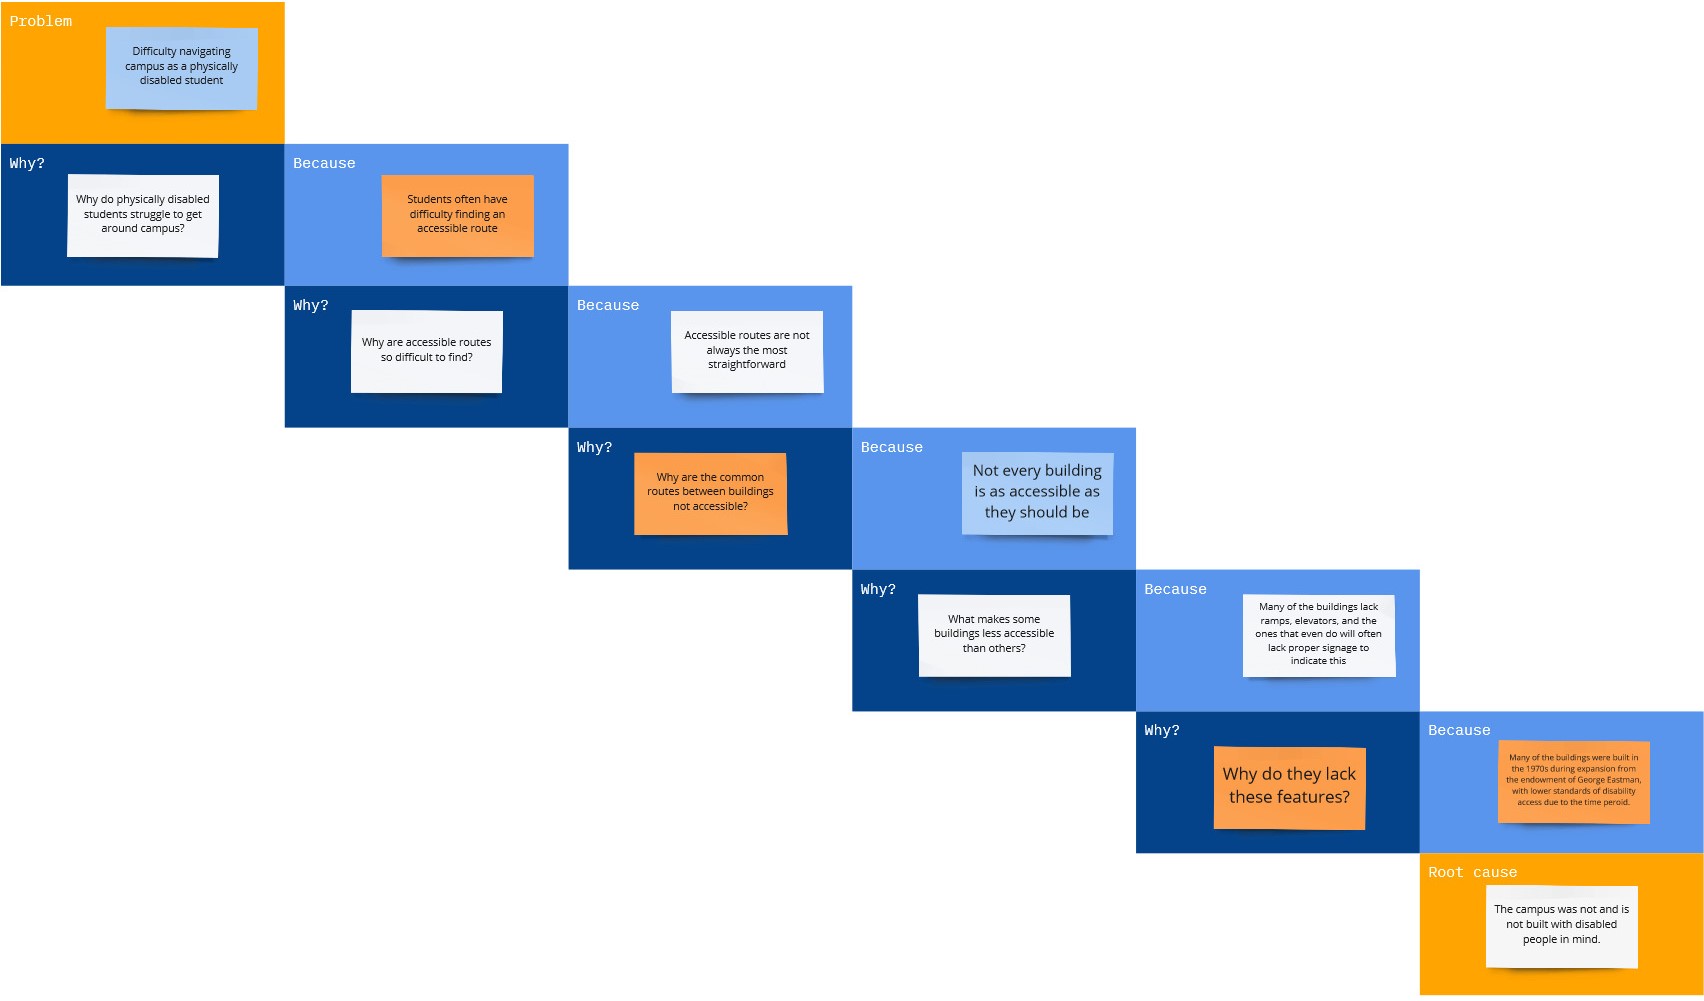
5 Whys exercise to find root of accessibility issue
October Project Pitch
We delivered an 8-minute pitch to our peers and faculty from our department.
We introduced our problem statement with statistics to back our claims before proposing our solution and a brief storyboard. There was a brief competitor analysis to demonstrate how our solution offers something new that serves our users better. We also reviewed our team roles and and a tentative design and development schedule.
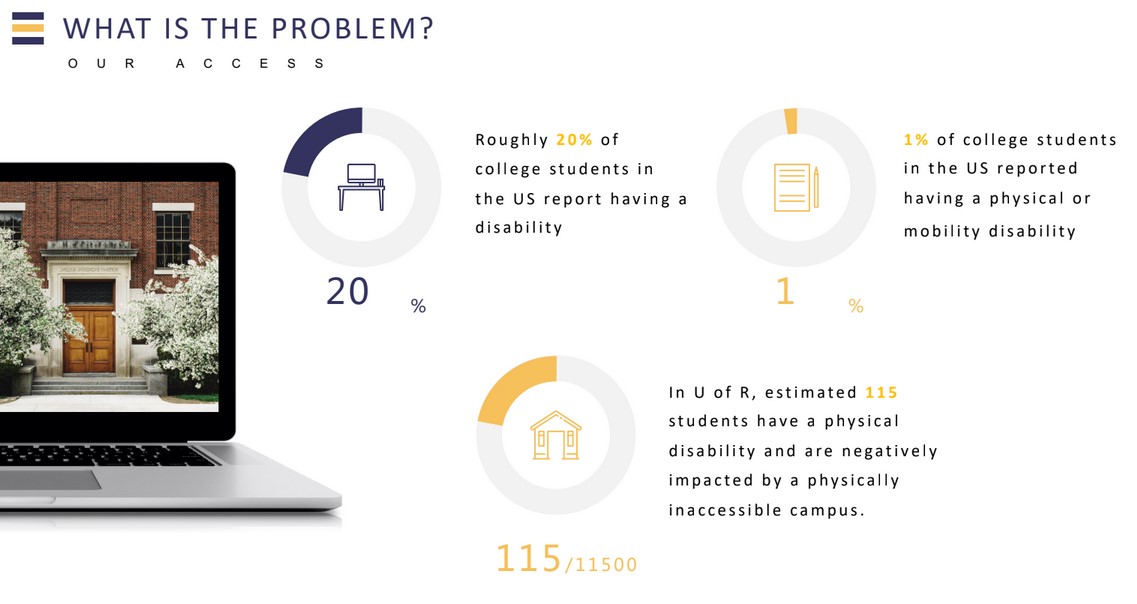
Statistics on problem from our pitch deck
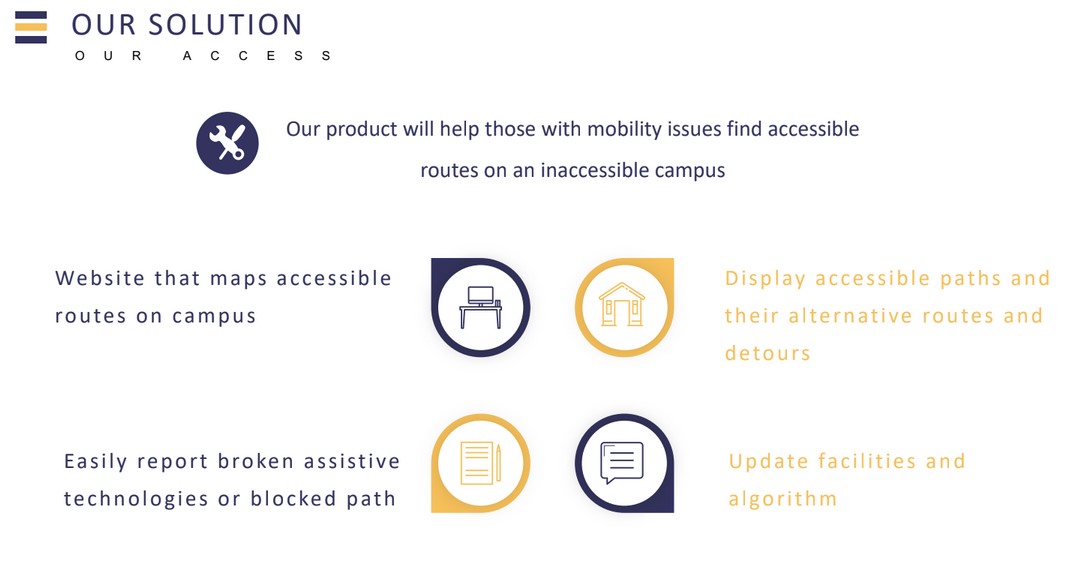
Solution slide from our pitch deck
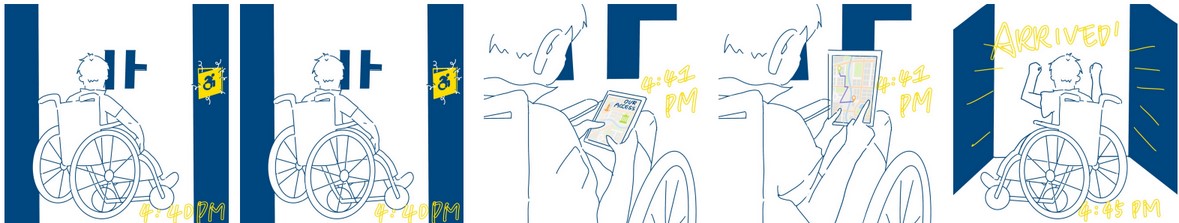
Storyboard from our pitch deck
November User Research
We sent out a survey and conducted interviews with students on campus, with different questions for those with mobility issues vs those without. The questions focused on accessibility on campus, experienced or perceived, with a focus on navigation, common access issues, and the current process of reporting something broken to facilities. We also asked questions about what mapping applications people currently use and why in order to determine user needs outside of accessibility.
Our team also met with higher-ups in facilities for our campus to learn about how the ticketing system for repairs works and how our site's report feature can work with the existing system.
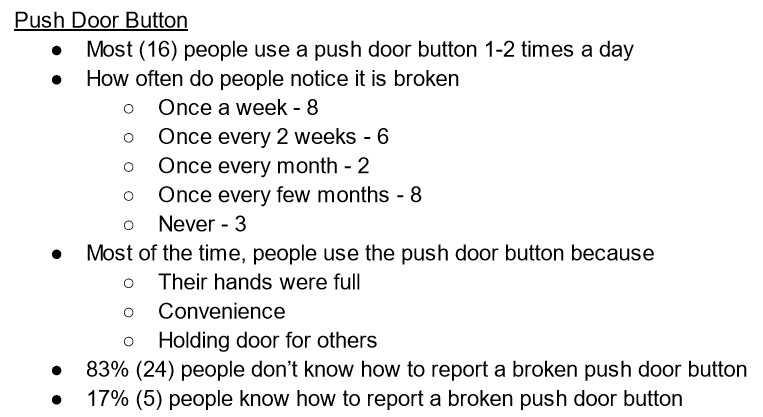
Survey analysis on questions about push door buttons
December Mid-Fidelity Prototyping
After implementing what we learned in the research stage into our site requirements, our UX team sketched out wireframes for our site. The development team then made notes on what was and was not in scope for our yearlong project, and some changes were made to make the site more disability-centered. The UX team used the reviewed wireframes to create a low-fidelity interactive prototype using Figma.
We observed our peers testing our prototype and made notes on what elements of the interface were confusing and how we could improve our site's user experience.
Low-fidelity prototype map input UI
January Preliminary Development
The development team has been testing different ways of coding the site and optional features like location tracking. We currently have a demo site that finds the shortest path given specific access needs. The coding for the final site may look different from the demo site, as we are currently looking at the Leaflet JS framework for GPS, custom icon, and accessibility features.
The UX team is creating a high-fidelity prototype on Figma using the feedback we received testing the low-fi version. The UX team is in close contact with the development team so they can update the prototype as different features are developed.
Our team began collecting volunteers to do assess accessibility of each building later in the semester.
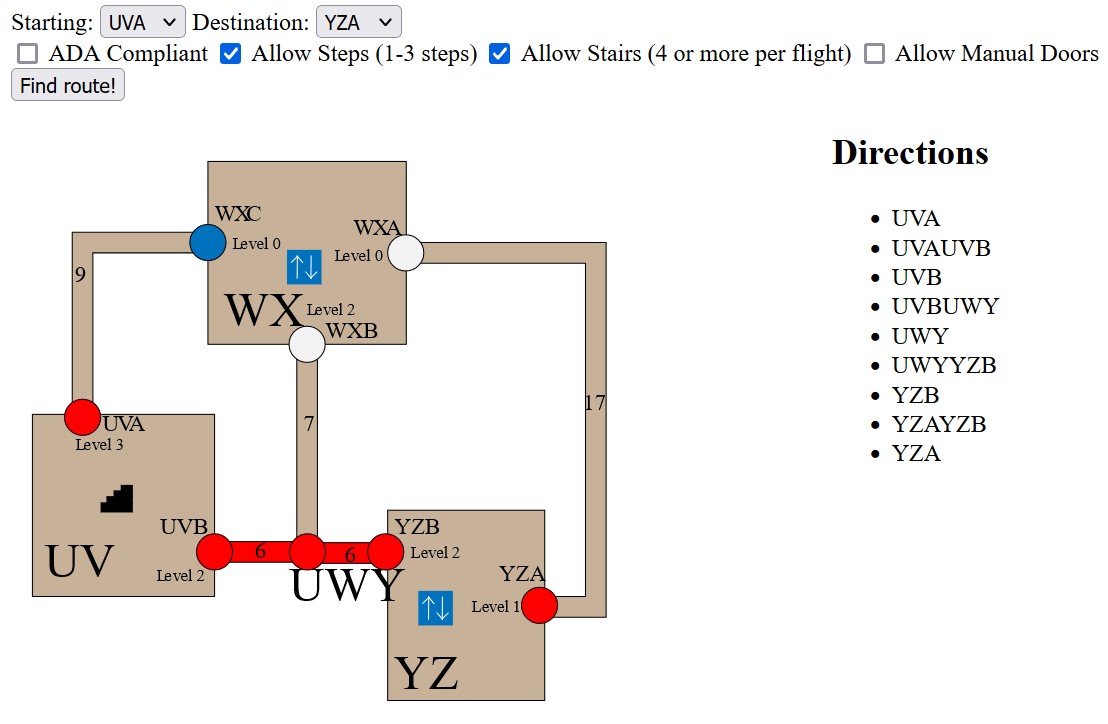
Customized accessible route on demo site
February Prototype Testing
The UX team finished development on a high-fidelity prototype and conducted three user tests observing volunteers begin a route, report an access issue, and end a route.
Notes were taken on the user tests on confusing aspects of the interface and what could be improved.
I was in communication with the UX team throughout the prototyping process to let them know what was feasible for site development.
Prototype page of map displaying route directions
March Data Collection and Poster Design
Team members and volunteers evaluated buildings and filled out the floor plans to show the accessibility features and obstacles of different entrances and paths.
The group collectively brainstormed how to present our project to the rest of the university by creating a slogan and some ideas for a poster. The graphic design team created several poster iterations before the group decided on the one shown on the right.
I was responsible for assigning buildings to volunteers for data collection, taking preferences listed in the volunteers' sign up forms, and served as the team's point of contact for volunteers. I also aided the graphic design team with minor layout and content adjustments for the final poster.
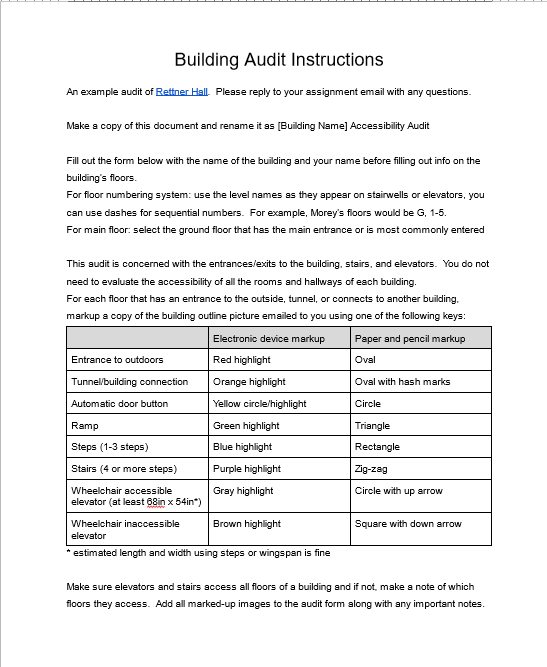
Data collection instructions for volunteers
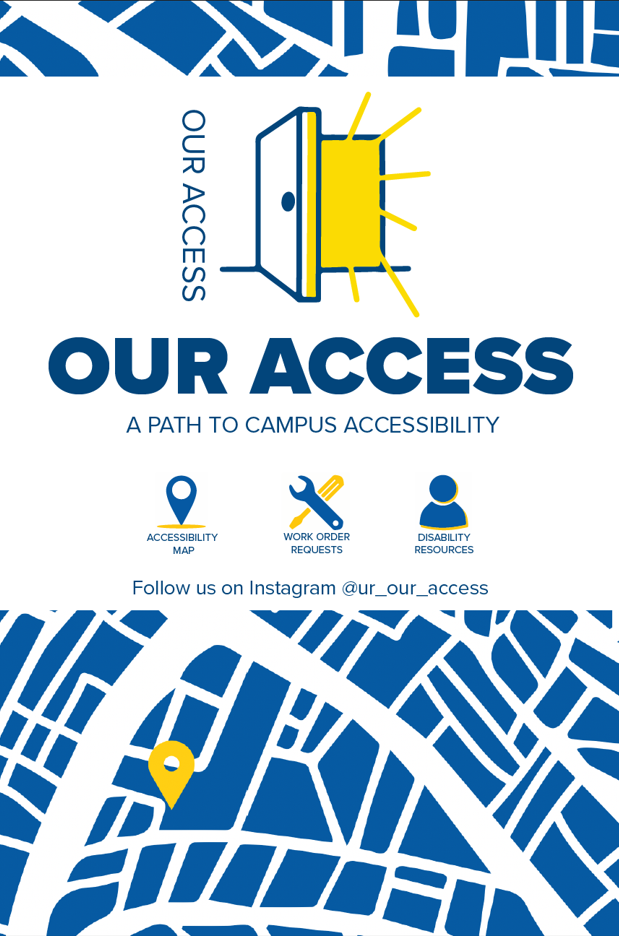
Promotional poster design
April Site Development
I worked as the sole web developer for the team. I coded an algorithm to find the shortest accessible route and used the Leaflet open source Javascript framework to display the route and directions. Other pages I coded include general on-campus disability resources and a form to request repairs for broken accessibility features.
I also developed the data entry methodology and was one of the group members that inputed building accessibility data into the appropriate spreadsheets for the site.
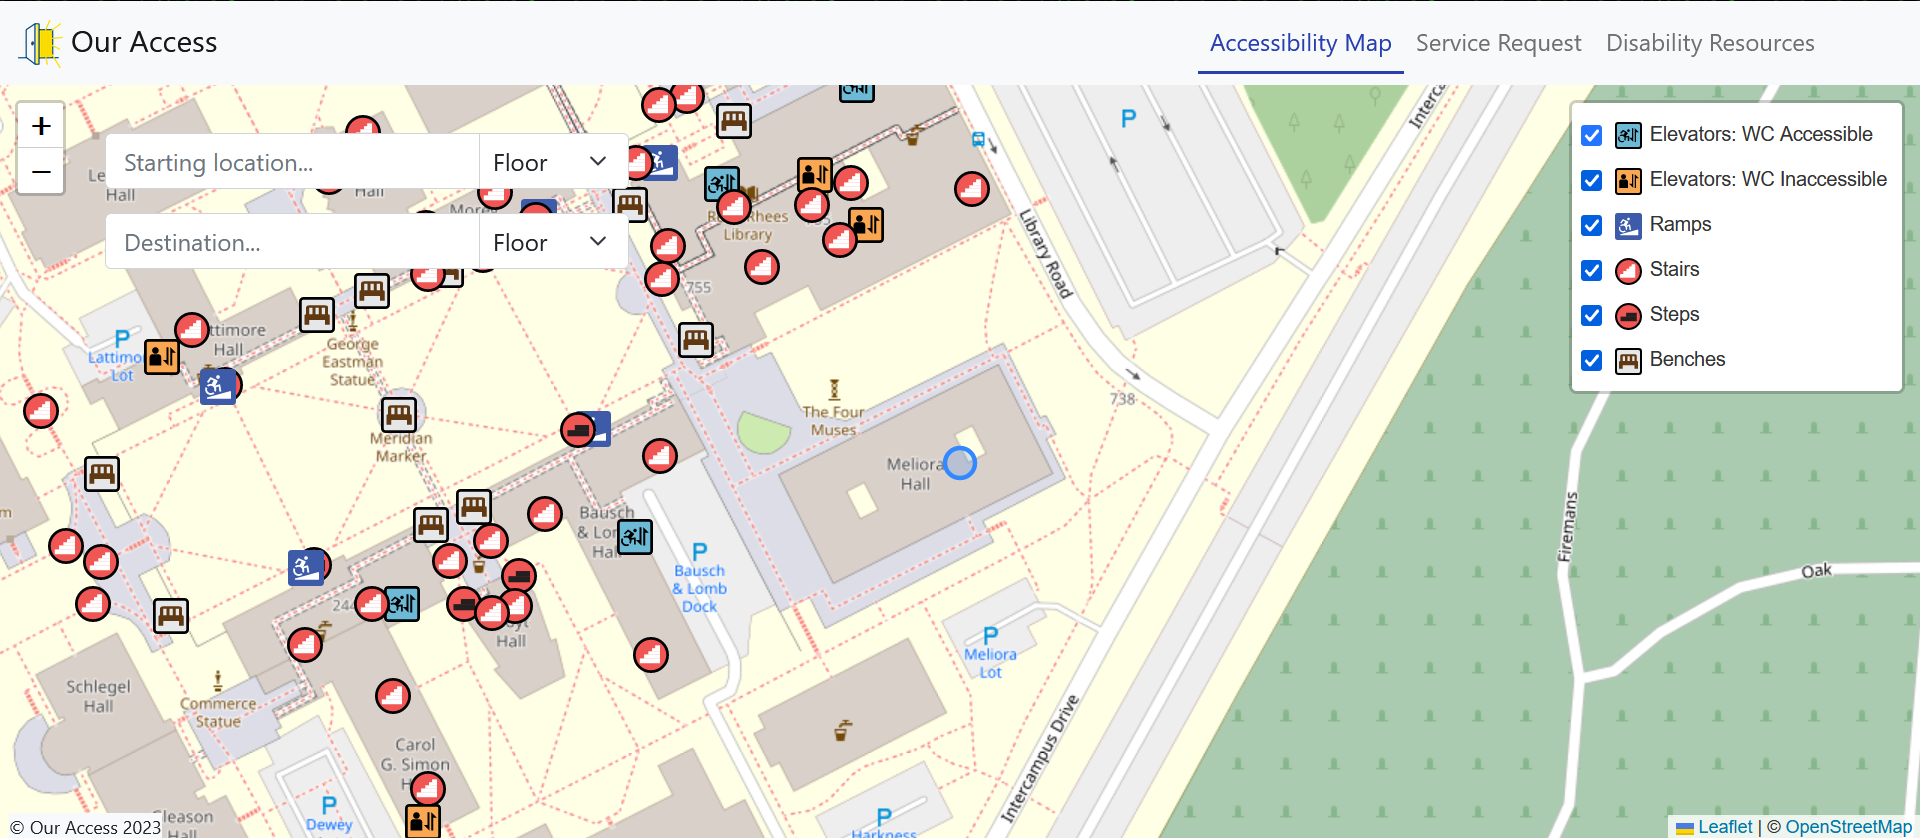
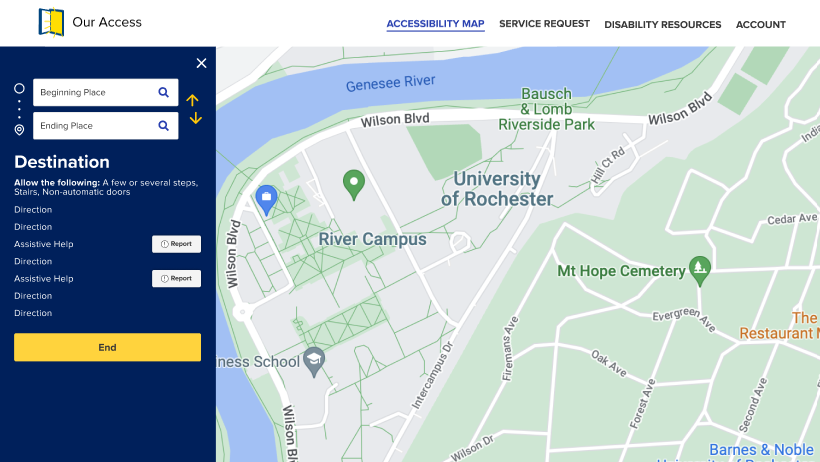
Desktop view of accessibility map